Data-driven
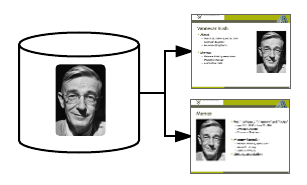
Current presentation tools have an extensive editor with many toolbars and buttons but most of these elements are related to the layout and style of content. It is interesting to see that these presentation tools offer a lot of support for aesthetics but hardly offer support for creating good content. In contrast, MindXpres takes a data-driven approach and tries to put the focus on the content instead.
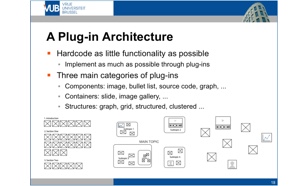
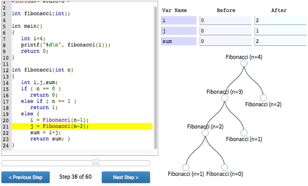
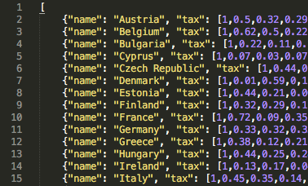
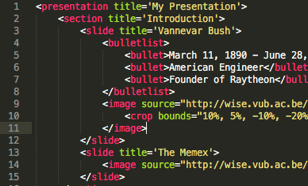
This approach can be seen throughout various components of the MindXpres presentation platform. First of all, inspired by languages such as LaTeX many containers will style and lay out content within automatically. It is still possible to change these manually but in most cases the suggested layout should be satisfactory. Next, the declarative authoring language allows users to define their presentation with an easy to use declarative syntax where MindXpres will handle most of the styling and layout automatically. Also the plug-in architecture contributes to MindXpres being data-driven. For instance, when users want to visualise programming code in an attractive manner they simply give the source code to the source code visualisation plug-in and the plug-in will handle the rest. This is in contrast to existing tools where the visualisation of certain content types is a tedious and time-consuming process. Similarly, creating dynamic and interactive graphs based on raw data is relatively simple when using the interactive graph plug-in. This allows presenters to focus on the message they want to convey instead of spending their time on aesthetics, and still get good-looking results.
Relevant Publications
Feature Overview

