Dynamic and Interactive Content
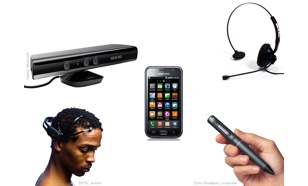
Digital slides have evolved from photographic slides and overhead projectors, but little has changed since then. Slides are still limited in space and content is still relatively static. Even though one might add content such as video the modern computer is capable of much more. As discussed in the Multimodal Interaction section MindXpres doesn't limit interaction to just the mouse or keyboard. All sorts for hardware can be used to interact with a MindXpres presentation by both the presenter and the audience. Furthermore, the plug-in architecture allows developers to write custom visualisation plug-ins for all kinds of content. Combined with the new interaction modalities, MindXpres can offer much richer content visualisations. Content does not have to be static anymore and can be dynamic and react to user input. As MindXpres presentations are compiled to HTML5-based bundles developers can also make use of the many existing Javascript libraries for content visualisation when developing MindXpres component plug-ins. This page will highlight some of the more interesting plug-ins we have developed for data visualisation. More interesting content plug-ins that focus on audience interaction are presented in the Networked Presentations section.Example Plug-in: Interactive Data Visualisation
One shortcoming in many existing tools is related to data visualisation and exploration. When creating a graph in for instance PowerPoint, the graph type or the data that is used to generate the graph can not be changed at run-time and the graph becomes what is essentially an image. Possible workarounds include the use of animations and creating multiple versions of the chart, but these are tedious and are often skipped because of the required work. However, research has shown the importance of data exploration and data-driven storytelling. To address this issue we have created an interactive data visualisation plug-in. The presenter starts by providing a dataset and can then define a series of views on the data to step through during the presentation. In between steps the presenter can change the chart type, change the data that should be used (e.g. filter the data or disable certain categories) and various other chart parameters. The presenter can not only predefine a sequence of views on the data but it's also possible to interact with the chart freely during the presentation in order to answer unexpected questions.
Example Plug-in: Interactive Source Code Visualisation
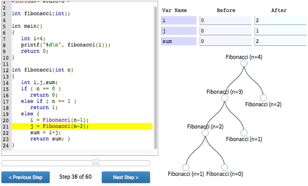
Presenting source code in existing presentation tools is not always optimal. Space is limited, and syntax highlighting and formatting is often lost when copy-pasting from the programming environment. To address this issue we have created a source code visualisation plug-in. Not only does the plug-in offer scrollable code, it also performs syntax highlighting and formatting automatically. Furthermore, it's possible to step through the code as it executes and presenters can plug in various visualisations to visualise the current state of the application. The video below shows a presenter stepping through the recursive version of the fibonacci algorithm while showing the values of the relevant variables above the recursion graph.
Example Plug-in: Enhanced Video Player
Although most presentations tools support the inclusion of videos, some features can be added to make them more suitable for education. At it's core the enhanced video player just plays back videos like any regular video component but adds some new functionality. For instance, the presenter can configure the plug-in to pause the video at predefined moments, add captions or highlights and resume play after a certain time period. Other features include the ability to set up bookmarks for the video which allows the presenter to jump to the relevant parts more easily.

More Plug-ins: Audience Interaction
Please refer to the Networked Presentations section for plug-ins related to audience interaction.Relevant Publications
-
Roels, R., Vermeylen, C. and Signer, B.: "A Unified Communication Platform for Enriching and Enhancing Presentations with Active Learning Components", 2014, Proceedings of ICALT 2014, 14th IEEE International Conference on Advanced Learning Technologies, Athens, Greece, July 2014 (best paper award)


-
Roels, R., Mestereaga, P. and Signer, B.: "Towards Enhanced Presentation-based Teaching of Programming: An Interactive Source Code Visualisation Approach", 2015, Proceedings of CSEDU 2015, 7th International Conference on Computer Supported Education, Lisbon, Portugal, May, 2015 (best paper award)


-
Roels, R., Baeten, Y. and Signer, B.: "An Interactive Data Visualisation Approach for Next Generation Presentation Tools - Towards Rich Presentation-based Data Exploration and Storytelling", 2016, Proceedings of CSEDU 2016, 8th International Conference on Computer Supported Education, Rome, Italy, April, 2016 (Best Paper Award Nomination)


-
Roels, R., Mestereaga, P. and Signer, B.: "An Interactive Source Code Visualisation Plug-in for the MindXpres Presentation Platform", 2016, (extended version of CSEDU 2015 paper), Communications in Computer and Information Science (CCIS), 583, 2016


-
Roels, R., Baeten, Y. and Signer, B.: "Interactive and Narrative Data Visualisation for Presentation-based Knowledge Transfer", 2017, (extended version of CSEDU 2016 paper), Communications in Computer and Information Science (CCIS), 739, 2017


Feature Overview
